
WordPress Maintenance
Why Is My WordPress Website Slow? A Practical Speed Audit for 2026
Updated
By Nail Mukhtarov | Founder of MEND FWD | October 22, 2026
A slow website can be frustrating. You open a page, wait for the content to appear, and sometimes wait a little longer before everything starts working properly.
When this happens with WordPress, the first reaction is often to blame the platform, the hosting provider, or a plugin.
But I don’t think guessing is a good way to solve performance problems.
I work with WordPress websites, and one thing I’ve learned is that speed problems aren’t always where you expect them to be.
A large image might slow down one website. Another might have unnecessary JavaScript. Sometimes the issue is related to how the page is rendered in the browser.
The only way to understand what’s happening is to test the website and look at the results.
Recently, I decided to do exactly that with my own website, MEND FWD.
The results were interesting, especially when I compared desktop and mobile performance.
I Started With Google PageSpeed Insights
My first step was simple.
I opened Google PageSpeed Insights, entered my website address, and tested both the mobile and desktop versions.
I wanted to see how the website performed before making any changes.
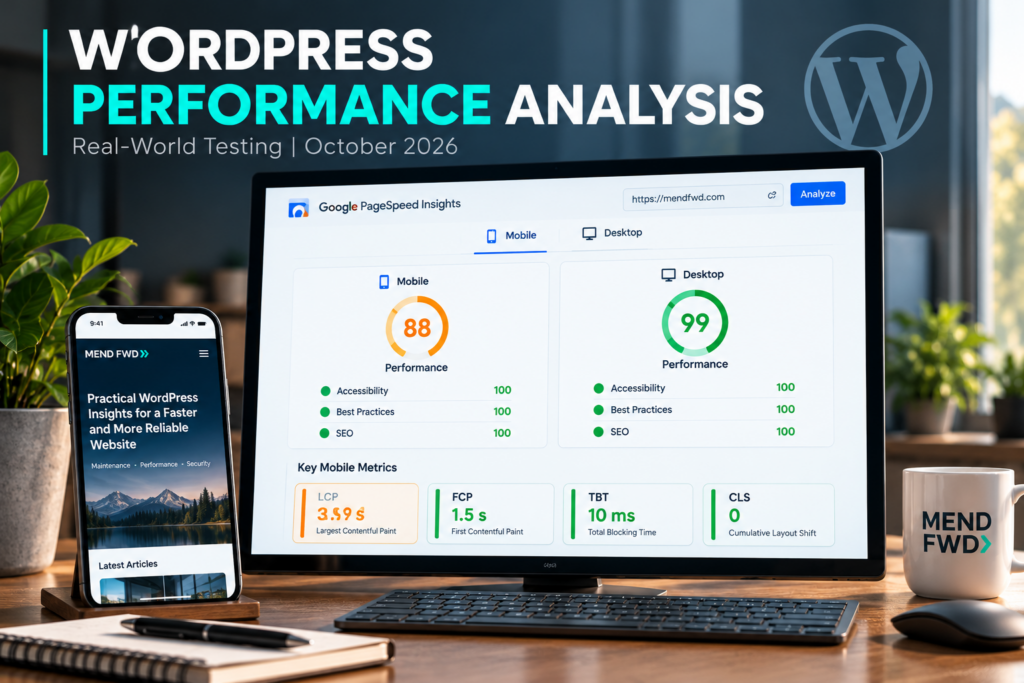
Here are the results from October 22, 2026.
| Metric | Mobile | Desktop |
|---|---|---|
| Performance | 88/100 | 99/100 |
| Accessibility | 100/100 | 100/100 |
| Best Practices | 100/100 | 100/100 |
| SEO | 100/100 | 100/100 |
At first glance, these are good results.
The desktop version performed particularly well, while the mobile version had some room for improvement.
What interested me wasn’t the difference between 88 and 99.
It was understanding why that difference existed.
A performance score gives you a useful starting point, but it doesn’t explain everything.
That’s why I decided to look more closely.
The Mobile Website Told a Different Story
In the mobile performance report, I found several useful measurements.
The First Contentful Paint (FCP) was 1.5 seconds.
This measures when the browser first displays content such as text or an image.
The Speed Index was 2.6 seconds, which gave me another indication of how quickly the visible page appeared.
The Total Blocking Time was just 10 milliseconds.
That’s a good result. It suggests that the browser wasn’t spending much time blocked by long tasks during the laboratory test.
Cumulative Layout Shift (CLS) was 0.
This means the test didn’t detect unexpected movement of the page layout.
But one metric stood out.
Largest Contentful Paint (LCP) was 3.9 seconds.
Google recommends an LCP of 2.5 seconds or less for a good user experience.
So although the overall mobile performance score was reasonable, the largest visible content element was taking longer to appear than I wanted.
This gave me something specific to investigate.
The Problem Wasn’t What I Expected
When people talk about slow WordPress websites, images are often the first thing mentioned.
And that’s understandable.
Large, poorly optimized images can make a significant difference to loading times.
But in my test, the largest content element wasn’t a photograph.
It was a block of text near the top of the homepage.
That was interesting.
I had expected to spend time looking at image sizes, but the report pointed me toward how the page was being displayed.
The diagnostic results also suggested that some resources could be delaying the browser’s rendering process.
This doesn’t automatically mean those resources are the entire cause of the slower LCP result.
But it gives me a better direction for further investigation.
And that’s exactly why I prefer measuring performance before changing anything.
If I had immediately started compressing images or installing another optimization plugin, I might have spent time solving the wrong problem.
I Used Firefox to Investigate Further
After reviewing the Google results, I opened Firefox Developer Tools.
Firefox includes a Network Monitor that shows the resources a webpage requests while loading.
It’s a useful tool because it helps me understand what the browser is actually doing.
I can see the types of files being requested, how much data is transferred, and how long different parts of the loading process take.
For this test, I looked at the homepage under two conditions.
First, I loaded the website with the browser cache enabled.
Then I repeated the test with the browser cache disabled.
The results were:
| Measurement | Cache Enabled | Cache Disabled |
|---|---|---|
| Network requests | 21 | 21 |
| Transferred data | 22.69 KB | 58.39 KB |
| DOMContentLoaded | 366 ms | 430 ms |
| Load event | 395 ms | 493 ms |
The difference was noticeable.
When the browser could reuse cached resources, it transferred less data.
With caching disabled, it downloaded more information.
However, I wouldn’t use these two tests alone to claim that caching caused the entire difference.
Network conditions and other factors can affect individual measurements.
The tests were also performed in my browser environment, where some third-party requests were blocked by an extension.
That means the results describe those particular testing conditions, not every visitor’s experience.
Still, the comparison was useful.
It helped me see how the browser handled the page and why caching can matter.
It also reminded me that PageSpeed Insights and Firefox Network Monitor measure different things under different conditions.
A fast browser load event doesn’t necessarily mean that every Core Web Vitals metric will be equally good.
What I Learned From These Tests
The most useful part of this investigation wasn’t getting a high score.
It was finding out where to look next.
My desktop results were excellent.
The mobile version also performed well in several areas, but its LCP needed further investigation.
The browser tests showed relatively small amounts of transferred data and quick load events under the conditions I tested.
So I didn’t see a good reason to start changing WordPress settings immediately.
Instead, I identified a more specific question:
What is delaying the appearance of the main content on mobile devices?
That’s a much better starting point than simply deciding that the website needs another performance plugin.
I haven’t applied a new optimization based on these findings yet.
For now, the investigation has helped me narrow down the next steps.
I think that’s an important distinction.
A useful performance audit doesn’t always end with a dramatic improvement or a perfect score.
Sometimes it ends with a clearer understanding of what should be investigated next.
Five Things I Check When a WordPress Website Feels Slow
My own website test is just one example.
When investigating WordPress performance, I usually start with five areas.
1. Images and Media
Images can be one of the largest resources on a page.
I check whether they are larger than necessary, whether they use appropriate formats, and whether they are being loaded efficiently.
Modern formats such as WebP and AVIF can help reduce file sizes.
But I also pay attention to when images are loaded.
Lazy loading is useful for images further down the page, but delaying an important image at the top can actually make the initial loading experience worse.
I don’t try to optimize every image in exactly the same way.
2. JavaScript and CSS
Websites need CSS for styling and JavaScript for interactive features.
But unnecessary code can make a page slower.
I look at which resources the browser downloads and whether they are actually needed.
Sometimes a feature adds scripts that load across the entire website, even when that feature isn’t used on every page.
When I find something suspicious, I investigate before removing it.
It’s easy to break a menu, form, or another important feature by changing script-loading settings without testing.
3. Plugins
WordPress plugins are useful. They save development time and add functionality.
But I don’t believe that having fewer plugins automatically means having a faster website.
What matters is what those plugins do.
One poorly optimized plugin can create more problems than several lightweight ones.
I check whether plugins are necessary, properly maintained, and behaving as expected.
I also avoid making random changes on a live website.
Before updating, replacing, or removing important components, I want a reliable backup and a safe way to test the changes.
4. Hosting and Caching
Sometimes performance problems are related to the hosting environment.
A server may have limited resources, or it may be spending too much time processing certain requests.
Caching can reduce unnecessary work by allowing previously generated content or downloaded resources to be reused.
But I don’t treat caching as a universal solution.
Different types of caching solve different problems.
I want to understand the existing configuration before adding anything new.
Upgrading hosting without investigating the actual issue can also be an unnecessary expense.
5. Website Maintenance and Security
Performance and security are connected, but they aren’t the same thing.
I believe a WordPress website should be maintained regularly, not only when something stops working.
Outdated software can introduce security risks and compatibility problems.
At the same time, installing every available update without preparation isn’t a good idea.
I prefer a controlled maintenance process.
That includes keeping reliable backups, reviewing updates, checking compatibility, and testing important website functions afterward.
I also avoid making major performance changes directly on a live website when a safer testing environment is available.
A website that loads slightly faster but becomes unstable or less secure isn’t an improvement.
For me, good maintenance means finding a reasonable balance between performance, security, and reliability.
I also follow a careful process when updating WordPress. If you’re interested in how I handle updates, backups, and testing, you can read my guide on updating WordPress safely in 2026.
Why I Don’t Chase a Perfect Score
I know it’s satisfying to see a performance score of 100.
But I don’t think that should be the main objective.
A website can receive a high Lighthouse score and still have usability problems that aren’t reflected in that number.
The opposite can also happen.
A website might have a lower score because of a particular loading issue while still feeling reasonably fast in everyday use.
That’s why I prefer to look at individual metrics and investigate what they mean.
I also try not to make several optimization changes at once.
If I change too many things, it becomes difficult to know which change helped and which one caused a problem.
My approach is straightforward:
I measure the website, identify the issue, investigate possible causes, and test changes carefully.
Then I measure again.
I want improvements that I can explain, not just numbers that happen to look better.
My Advice to Small Business Owners
If your WordPress website feels slow, I wouldn’t recommend installing another optimization plugin as the first step.
Start by checking what is actually happening.
Google PageSpeed Insights is a good place to begin.
Look at the mobile results, not just desktop.
Pay attention to Core Web Vitals, especially Largest Contentful Paint.
If you’re comfortable using browser developer tools, take a look at the resources your website loads.
And remember that one test doesn’t tell the whole story.
For a business website, reliability matters just as much as performance.
Visitors should be able to find information, use navigation, and send contact forms without problems.
There’s no value in improving a performance score if an important part of the website stops working.
Final Thoughts
Testing my own website reminded me of something simple.
A performance problem isn’t always where you expect it to be.
My desktop test returned 99 out of 100.
The mobile version scored 88.
Both were encouraging results, but the mobile test also showed that the main content could appear faster.
By looking beyond the overall scores, I found a more useful direction for further investigation.
I didn’t need to guess.
And I didn’t need to make unnecessary changes to the website.
I just needed to look more carefully at the data.
That’s how I prefer to approach WordPress development and maintenance.
Understand the problem first. Make changes when there’s a good reason. And always check that the website still works properly afterward.
A fast website is good. A fast, secure, and reliable website is better.
About the Author
I’m Nail Mukhtarov, founder of MEND FWD.
I work with WordPress development, website maintenance, security, and technical troubleshooting.
My approach is simple: I prefer practical solutions, careful testing, and websites that are easy to maintain.
Through MEND FWD, I share what I learn while working with real websites, including technical problems, maintenance practices, and ways to improve performance without unnecessary complexity.
Technical References
The performance concepts and general recommendations discussed in this article are supported by official documentation:
- Web Vitals: https://web.dev/articles/vitals
- PageSpeed Insights: https://pagespeed.web.dev/
WordPress
- Performance Optimization: https://developer.wordpress.org/advanced-administration/performance/optimization/
- WordPress Caching: https://developer.wordpress.org/advanced-administration/performance/cache/
Mozilla
- Firefox Network Monitor: https://firefox-source-docs.mozilla.org/devtools-user/network_monitor/
Need help with your WordPress website?
MEND FWD provides practical WordPress repair, maintenance and web development support for small businesses.